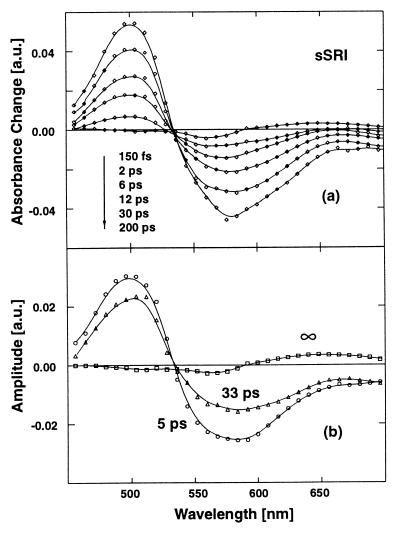
Figure 6.
(a) Transient absorption spectra for sSRI at different delay times. (b) Decay-associated spectra (amplitude spectra) of the recorded sSRI transients. Excited-state absorption (λ < 530 nm), ground-state bleaching (λ ≈ 580 nm), and stimulated emission (λ > 650 nm) are clearly visible in the transient spectra and in both picosecond amplitude spectra.

