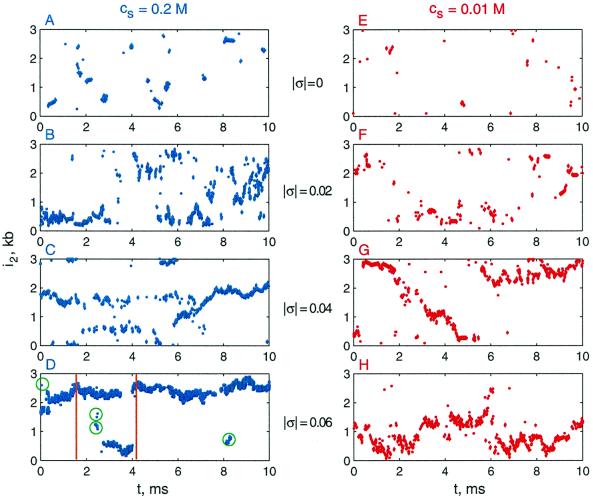
Figure 2.
Juxtaposition of a selected site with other sites of DNA molecule as a function of time. The coordinate of the second site, i2, was recorded over one BD trajectory. Simulations for DNA molecules 3 kb in length were performed both for physiological (Left) and low (Right) salt concentrations, with different σ values (as noted). The circled points in D correspond to collisions between sites separated along the superhelix axis (“random collisions”); all other points in the panel result from juxtapositions across the superhelix axis.

