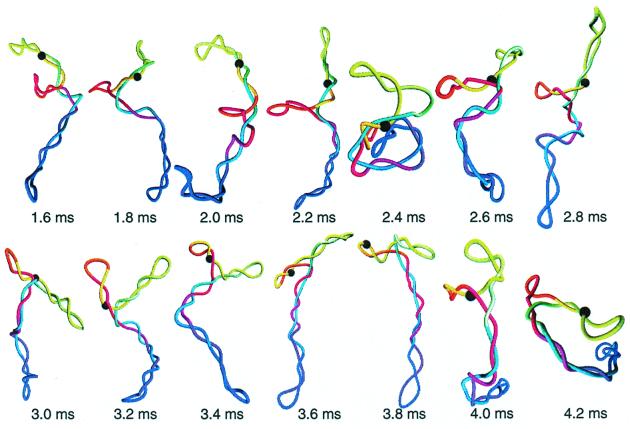
Figure 3.
Dynamics of the site juxtaposition in supercoiled DNA. Snapshots represent the part of the simulation trajectory shown in Fig. 2D (σ = −0.06, [Na+] = 0.2 M). Site i1 is shown by a large black sphere. The actual simulated orientation of the molecule was rotated to enhance connection between successive conformations.

