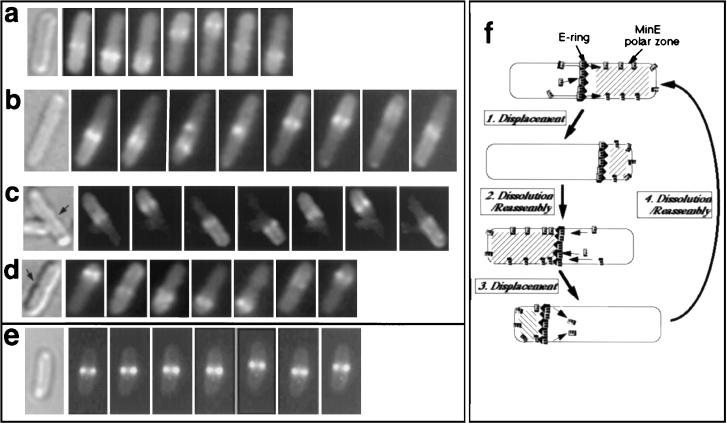
Figure 2.
Time-lapse analysis of MinE-Gfp and Gfp-ZipA. (a–f) Cells of the following strains were grown for 4 h in the presence of 10 μM IPTG before fluorescence microscopy of unfixed cells. (Left) Nomarski. (Right) Fluorescence micrographs at 20-s intervals (left to right). Arrow indicates nascent septum. (a) RC1/pFX7 [Δmin/Plac-minD minE∷gfp]. (b) PB103/pFX7 [minCDE+/Plac-minD minE∷gfp]. (c) RC1/pSY1083G [Δmin/Plac-minC minD minE∷gfp]. (d) RC1/pSY1083G [Δmin/Plac-minC minD minE∷gfp]. (e) PB103(λCH50) [minCDE +(Plac-zipA∷gfp)]. (e) Diagram of cyclic behavior of MinE-Gfp rings and polar zones, based on time-lapse fluorescence microscopy (a–d).

