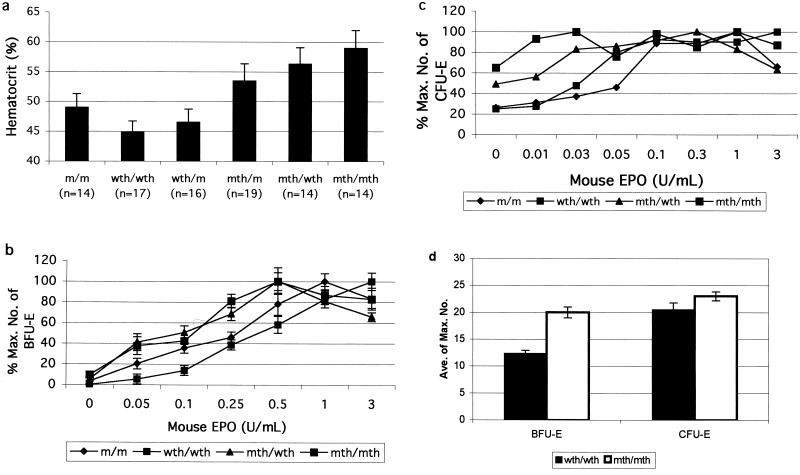
Figure 3.
Hematocrits and sensitivity of erythroid progenitors to EPO. (a) Hematocrits of 2- to 3-months-old mice heterozygous and homozygous for wthEPOR and mthEPOR. The mean and standard deviation of the hematocrit levels are shown for animal groups of each genotype: m/m and mth/m, P < 0.001; m/m and mth/wth, P < 0.001; m/m and mth/mth, P < 0.001; wth/wth and mth/wth, P < 0.001. (b and c) EPO dose–response curves of erythroid progenitors derived from heterozygous and homozygous mthEPOR mice and wthEPOR and mEPOR control mice. Plots of the number of erythroid colonies as a percent maximum versus the concentration of rm EPO. (b) In the BFU-E assay, 1 × 10⁵ bone marrow mononuclear cells were incubated in methylcellulose medium containing serum, indicated rm EPO concentrations, and optimal concentrations of appropriate growth factors. The experiment was repeated three times, and triplicate assays were performed each time. The figure represents data from one experiment. Each point indicates the mean ± standard deviation of triplicates representing one animal. (c) In the CFU-E assay, 2 × 10⁴ bone marrow mononuclear cells were incubated in methylcellulose medium with serum and rm EPO but no other exogenous source of colony-stimulating factors. The points indicate the mean of triplicates of culture representing one animal of each genotype. (d) Numbers of bone marrow-derived erythroid colonies detected in 1 × 10⁵ (BFU-Es) or 2 × 10⁴ (CFU-Es) of bone marrow mononuclear cells.

