Figure 4.
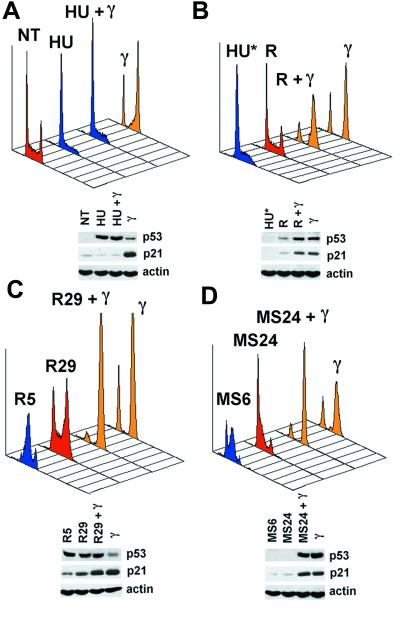
Impairment of p53 transcriptional activity requires arrest in S phase. (A) RKO cells were treated as described in Fig. 3A and subjected to cell cycle analysis. NT, not treated. (B) HU-treated cells were γ-irradiated 12 h post-HU treatment. Five hours after γ-IR cells were released by extensive washing (HU* represents the profile at the moment of release for both irradiated and unirradiated cells). Forty eight hours later the released population (R, release) and the released γ-irradiated population (R + γ) were compared with irradiated asynchronous cells (γ). (C) Cells released from HU treatment were irradiated at the moment they were progressing through S phase (R5, S phase: 98.8%). Twenty four hours postirradiation the released unirradiated populations (R29) and the released γ-irradiated populations (R29 + γ) were compared with irradiated asynchronous cells (γ). (D) Cells progressing through S phase after replating of mitotic cells were irradiated (MS6, S phase: 79.8%). Twenty four hours postirradiation the released unirradiated (MS29) and the released γ-irradiated populations (MS24 + γ) were compared with irradiated asynchronous cells (γ). The levels of p53 and p21 are shown. Actin was used as a loading control. In each case the red profile represents asynchronous cycling cells, the blue profile represents cells mainly in S phase, and the yellow profile represents cells arrested with a typical γ IR distribution.

