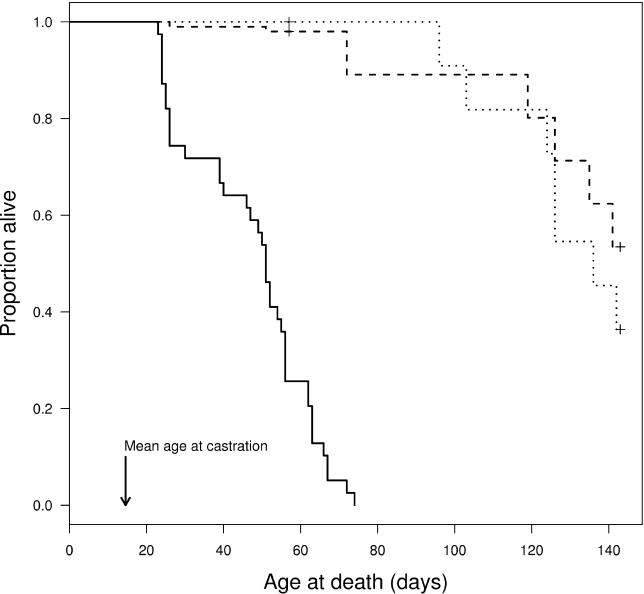
Figure 1. Proportion of Hosts Surviving over Time Depending on Treatment.
Solid, dashed, and dotted lines represent infected, exposed but uninfected, and unexposed control daphniids, respectively. Survival analysis showed a highly significant difference in survival between the infected as compared to unexposed control hosts ( p < 0.001), while there was no difference between the two groups of uninfected daphniids ( p = 0.719). The + symbols at the two curves representing uninfected daphniids indicate points where censoring was performed. For more details about the statistics, see Materials and Methods. Mean age at castration is the mean age at which infected animals became castrated. Age at castration is defined as the first day after a host's last reproduction. All infected daphniids had become castrated at an age of 19 d (17 d after infection + 2 d).

