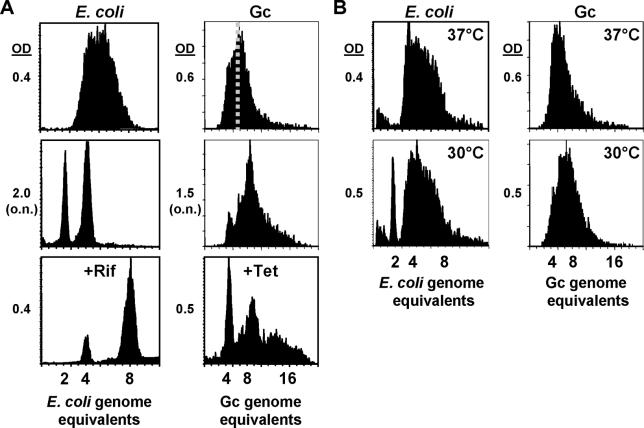
Figure 1. Flow Cytometry of Hoechst-Stained, Fixed Bacterial Cells.
For each histogram, the x-axis shows fluorescence levels, which indicate the amount of DNA content per particle counted. The y-axis shows counts, which indicate the number of fluorescing particles or cells. Culture optical densities (OD 600) are listed to the left of each corresponding histogram. o.n., overnight culture.
(A) E. coli (Column 1) and Gc (Column 2) growth curves under standard laboratory conditions. At mid-log phase, part of the culture was treated with rifampicin ( E. coli) or tetracycline (Gc). Genome equivalents were determined from the stationary phase and rif-treated E. coli and are shown on the x-axis. The dotted line represents the division line for sorting into higher and lower fluorescent populations.
(B) E. coli and gonococcal cultures grown to mid-log phase at 37 °C or 30 °C. Genome equivalents were determined from stationary phase and rif-treated E. coli as in (A).

