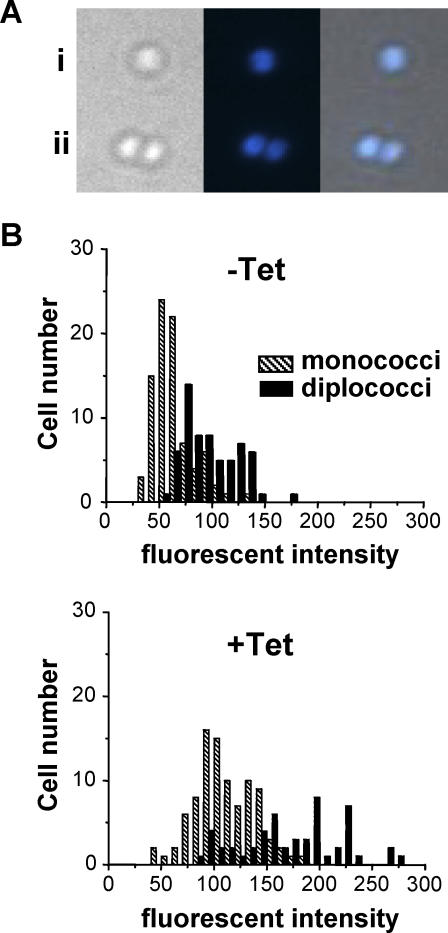
Figure 2. Microscopic Analysis of Gc DNA Content.
(A) Fluorescence microscopy of Hoechst-stained cells. Phase contrast, fluorescence, and merged images are shown for examples of each cell type observed. (i) monococci, (ii) diplococci. (B) Histogram of fluorescence intensities for exponentially growing and Tet-treated Hoechst-stained cells as determined from fluorescent micrographs.

