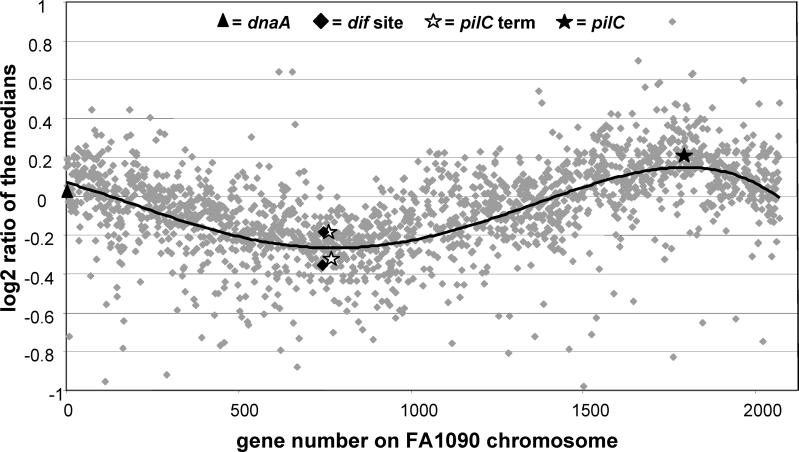
Figure 3. Marker Frequency Determined by Microarray Analysis.
Log2 ratio of the median differential hybridization signal of labeled DNA from untreated and Tet-treated exponentially growing cultures of N. gonorrhoeae. Gene number indicates the order of genes on the FA1090 genomic sequence starting with dnaA. The location of dnaA, pilC1, and the pilC1 associated terminus are indicated by symbols along with the location of the genes surrounding the dif site. The trend line was produced using polynomial regression with an order of 4.

