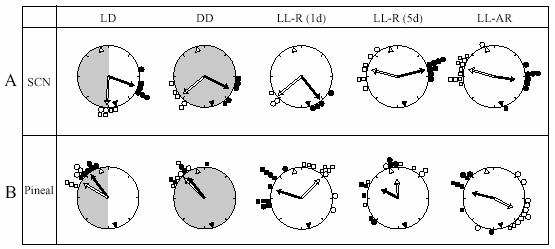
Fig. 4.

Peak phases of Per1-luc rhythms in SCN and pineal cultures. Time is indicated by position on the circle. The peak phase of each culture is represented by small circles [filled circles: cultures prepared at ZT 11 (filled triangle within the large circle); open circles: cultures prepared at ZT 23 (open triangle within the large circle)]. Arrows inside the large circle indicate the average phase of each group. The degree of synchrony within each group is indicated by the length of the arrow. The distribution within all groups was significantly non-random (Rao's spacing test, p<0.05). Light conditions (LD, DD or LL) and rhythmicity of rats (arrhythmic, AR or rhythmic, R) are shown at the top of the figure and by shading.
