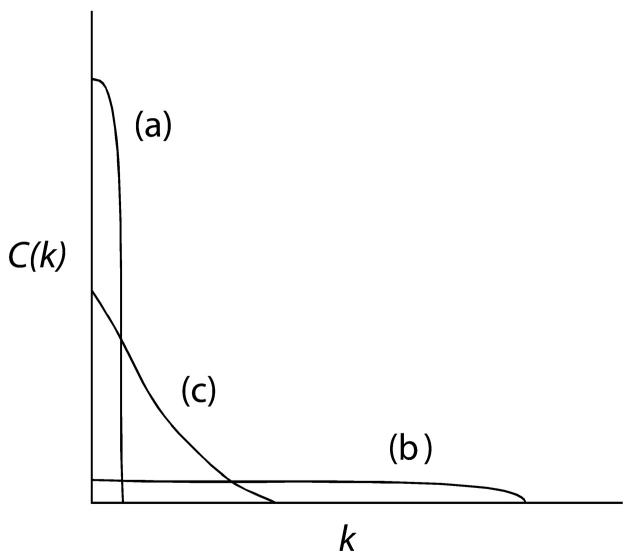
FIGURE 2—
Complexity as a function of scale.
Note. Schematic illustration of complexity C(k) (vertical axis) as a function of scale, k (horizontal axis). A system with the highest possible fine-scale complexity corresponds to a system with independent parts (curve a). When all parts act together, the system has the largest-scale behavior but the same low value of complexity at all scales (curve b). Complex systems have various possible scales of behavior, as illustrated by one example (curve c).

