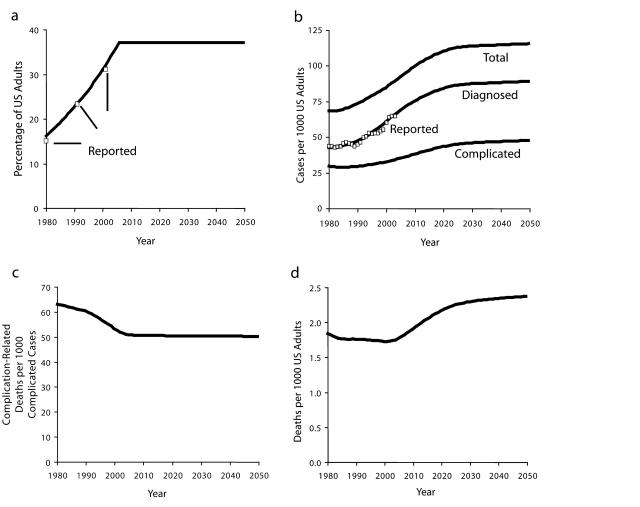
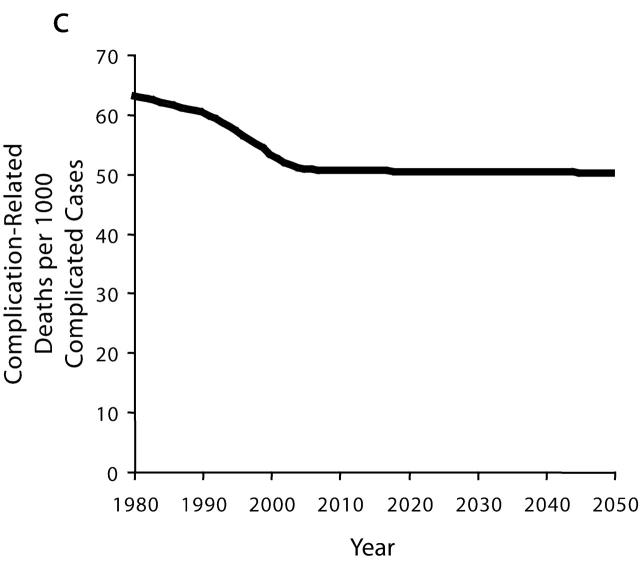
FIGURE 2—
Selected baseline model output, 1980–2050, and comparison to historical data for obesity prevalence (a), diabetes prevalence (b), complication-related deaths per complicated cases (c), and complication-related deaths (d).
Note. Reported obesity prevalence based on National Health and Nutrition Examination Survey,15 and reported diabetes prevalence based on National Health Interview Survey.14 Baseline projection assumes that obesity prevalence rises to 37% in 2006 and remains fixed thereafter, and that disease detection and control efforts all remain fixed after 2004.


