
FIGURE 2—
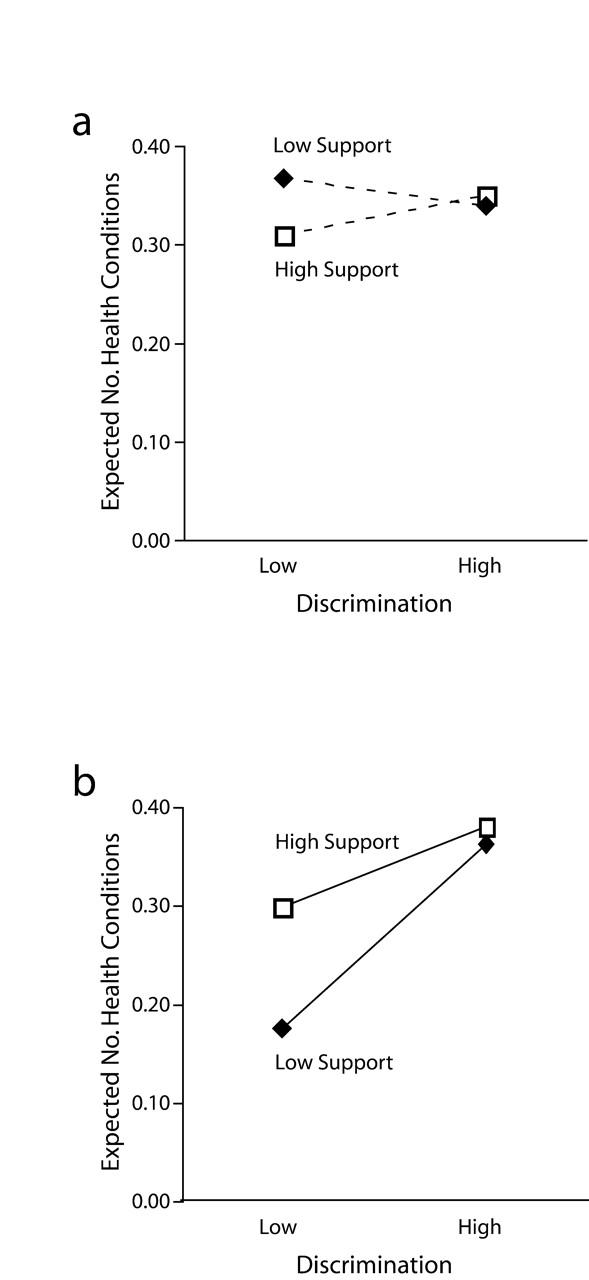
Relationships between everyday discrimination, instrumental support, and health conditions in San Francisco (a) and Honolulu (b).
Note. Shown are 3-way interactions with all covariates controlled. The slopes of solid lines are statistically different from 0; the slopes of dashed lines are not. “Low” refers to 1 standard deviation below the mean; “high” refers to 1 standard deviation above the mean.