
Figure 8.
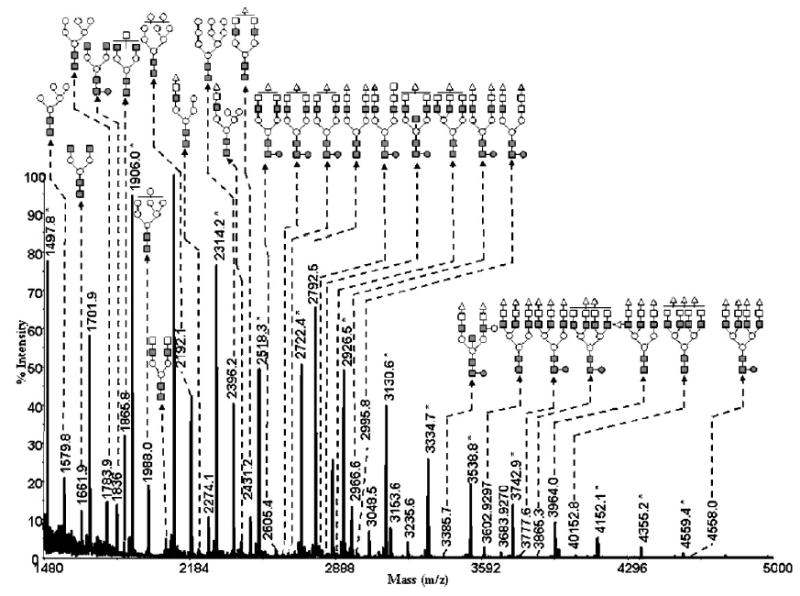
MALDI-TOFMS glycomic profile of permethylated N-glycans derived from 20 mg of rat liver tissue by using the 500 μm i.d. fused-silica capillary. Symbols: ■, N-acetylglucosamine; ○, mannose; □, galactose; ●, fucose; ▵, N-acetylneuraminic acid; ▴, N-glycolylneuraminic acid. Signals marked with asterisks originate from glucose ladders that are commonly present in tissue samples.