
FIGURE 2.
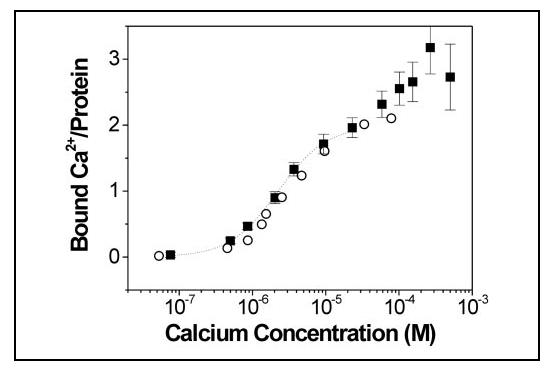
Equilibrium Ca2+ binding to CaBP1. Titrations of 45Ca2+ binding to CaBP1 were conducted using an ultrafiltration method, as described under “Experimental Procedures.” Number of ions bound per protein is plotted as a function of the free calcium concentration. Binding data measured in the absence and presence of 5 mm Mg2+ are indicated by black squares and open circles, respectively. The solid line represents the best fit to the Hill model using parameters as defined in the text, Kd = 2.5 μm and Hill coefficient of 1.3.