
FIGURE 9.
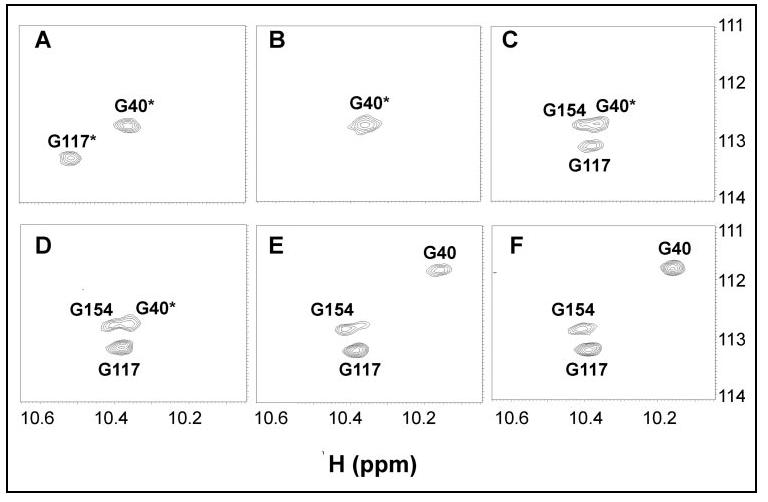
Downfield spectral region of 15N-1H HSQC NMR spectra of CaBP1 (200 μm) recorded as a function of increasing Ca2+ concentration in the presence of physiological Mg2+ (5 mm). The molar ratio of Ca2+/Mg2+ and {Ca2+/protein} in each case was 0.0 {0.0} (A), 0.04 {1.0} (B), 0.08 {2.0} (C), 0.16 {4.0} (D), 1.0 {25} (E), and 2.0 {50} (F). Asterisk indicates amide resonances assigned to Mg2+-bound CaBP1.