
Figure 3.
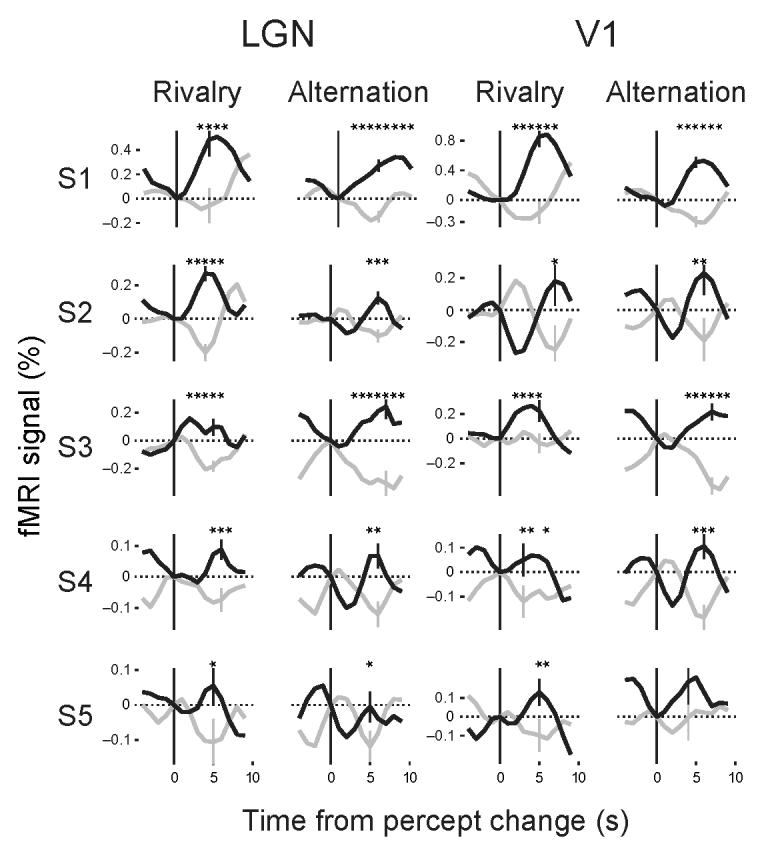
FMRI signals during binocular rivalry and physical stimulus alternations in the LGN and V1 (single subjects). Mean fMRI time series obtained while subjects (S1–S5) perceived the high-contrast grating (black) or low-contrast grating (gray) during binocular rivalry or physical stimulus alternations in the LGN and V1. In each subject, the fMRI signal increased in the LGN, and similarly in V1, after transitions to the high-contrast stimulus and decreased after transitions to the low-contrast stimulus. Differences in fMRI time series for high- and low-contrast in the rivalry scan were statistically significant in each individual subject in both LGN and V1 for at least the data point at the peak value of the curves (one-tailed t-test, P < .05). Within subjects, the shape of the curves is remarkably similar in the LGN and V1. Time series for physical alternations scans show a similar pattern as compared to those from the rivalry scans. The error bars indicate the standard error of the mean at the data point with the most significant response difference between the green and red curve in each panel. Other conventions are as in Fig. 2.