
Figure 4.
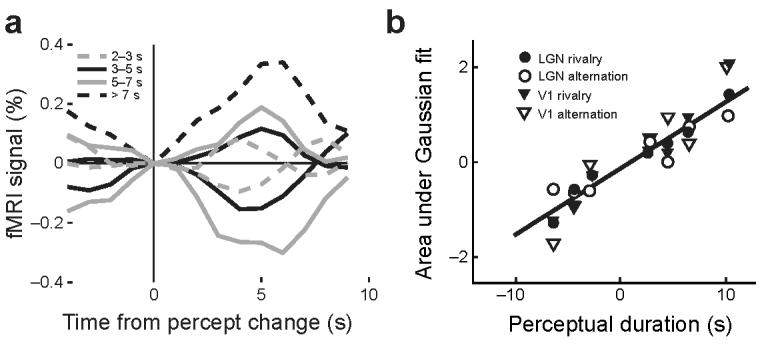
Effect of perceptual duration on fMRI signals. (a) FMRI time series averaged across subjects and time-locked to the subjects' manual responses are shown for the LGN as a function of perceptual duration. Dashed gray lines: 2–3 s, solid black lines: 3–5 s, solid gray lines: 5–7 s, dotted black line: >7 s (only shown for transitions to the high-contrast grating). The amplitude and duration of fMRI signals increased with increasing duration of the percept. (b) The time series data shown in (a) were fit to a Gaussian function. The area under these fitted curves was linearly correlated with the perceptual duration in the LGN (r = .98, P ≤ .02). A similar correlation was observed with fMRI responses measured during stimulus alternations in the LGN and during both conditions in area V1. The abscissa of each dot corresponds to the average duration of trials in the corresponding perceptual duration category. Positive values indicate perceptual durations of the high-contrast grating; negative values indicate those of the low-contrast grating.