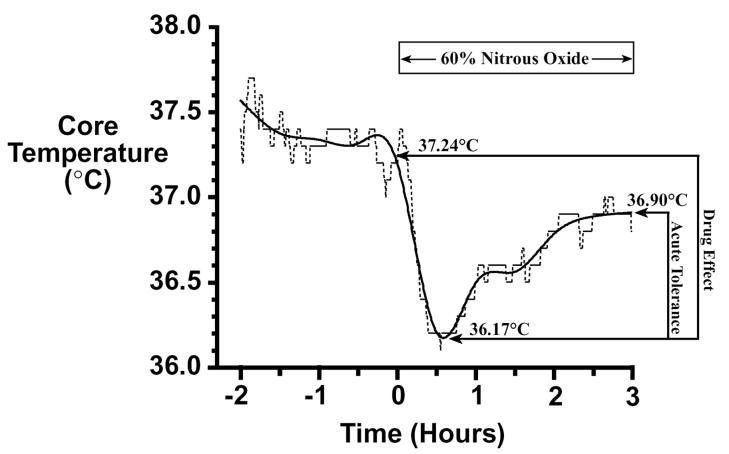
Figure 1.
Core temperature data (dashed line) from a single rat are smoothed (solid line) and calculations of baseline temperature, minimum temperature after drug onset, and the final temperature are made using the smoothed data. The drug effect equals 1.07°C (i.e., 37.24 minus 36.17), the drug effect regression residual equals 0.01637, and the drug effect Z-score equals 0.0308. Acute tolerance equals 0.73°C (i.e., 36.90 minus 36.17), the acute tolerance regression residual equals -0.01099, and the acute tolerance Z-score equals -0.0399. This rat is depicted in the scatterplot of Figure 2a as the most average rat.

