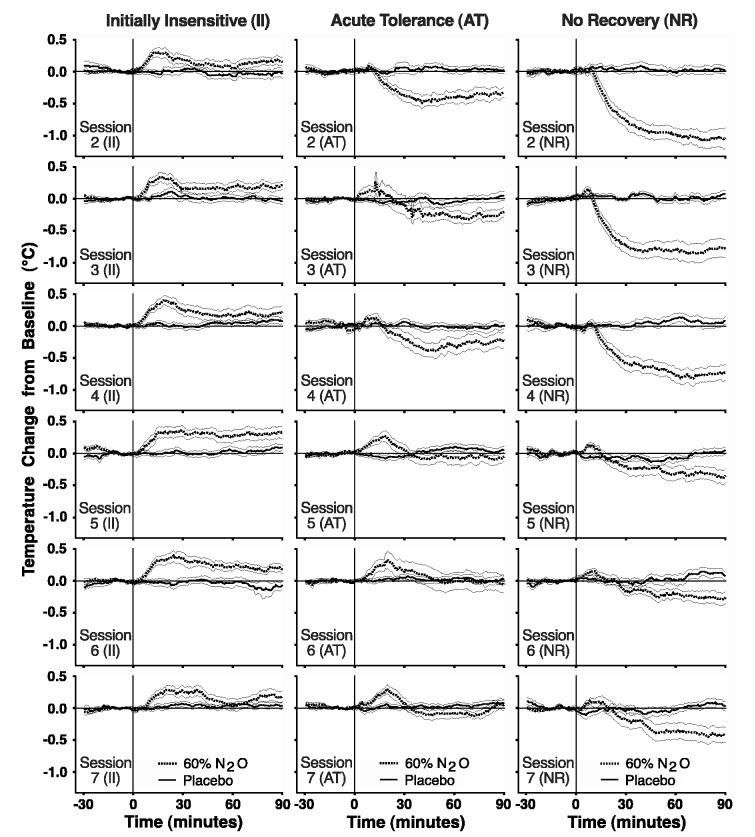
Figure 3.
Mean (± SEM) change of temperature from baseline is depicted for II, AT and NR rats receiving a 90-min steady-state administration of 60% N2O or placebo on the six exposures (i.e., Sessions 2-7) following the initial screening. The three columns represent the individual difference groups and the rows represent data from Sessions 2-7.

