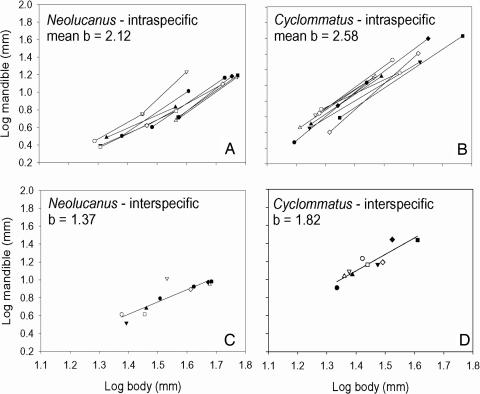
Fig. 2.
Comparison of intraspecific and interspecific allometries for the horns of stag beetles. (A and B) Intraspecific variation in 11 species of Neolucanus (A) and 10 species of Cyclommatus (B), where each line represents the allometric relationship for a different species, and the average exponent for these relationships is 2.12 for Neolucanus and 2.58 for Cyclommatus. (C and D) Interspecific allometries for the 11 species of Neolucanus (C) and 10 species of Cyclommatus (D), where each data point represents an average value of horn and body length for all measured individuals in a species, and the exponents are 1.37 for Neolucanus and 1.82 for Cyclommatus. Each of the symbols represents a different species: The symbol in the interspecifc plots represents the mean, and the pair of identical symbols connected by a line in the intraspecific plots represents the range of variation (±2 SD). Data were replotted and exponents were recalculated from Kawano (20). In A and B, note that the relationships for larger species are displaced to the right (lower Y0), reflecting increasing size at first reproduction.

