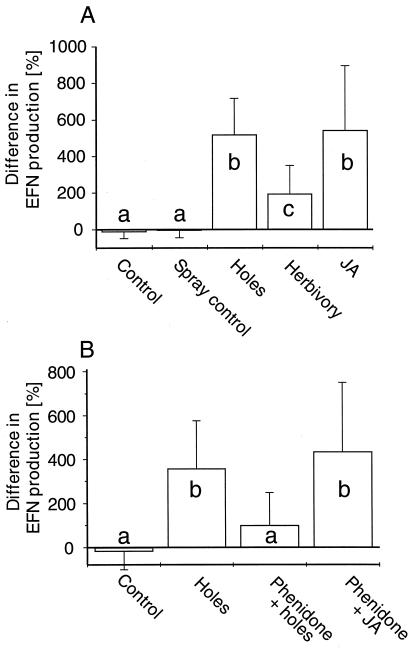
Figure 1.
Changes in daily EFN production (relative difference day 1/day 0) are given separately for different treatments (mean + SD). Different letters indicate significant differences between single treatments (for all significant differences: P < 0.05, post hoc test following repeated measures ANOVA with Fisher's least significant difference (LSD); see Tables 1 and 2 for ANOVA results; n = 10 plants for each treatment with four leaves per plant perceiving identical treatment). (A) Experiment on induction of EFN production. (B) Experiment on effects of phenidone treatment.

