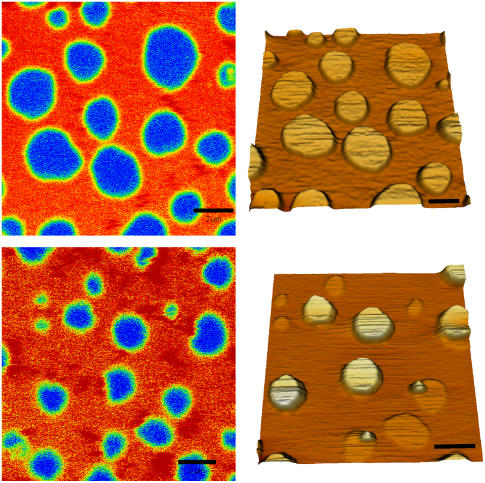
FIGURE 4.
Fluorescence image (left) and AFM topographical data (right) acquired on the same spot of the membrane at room temperature. The upper panel refers to a DOPC/cholesterol/SM/Cer 1:1:0.88:0.12 sample (4% Cer), the lower panel to a DOPC/cholesterol/SM/Cer 1:1:0.64:0.36 sample (12% Cer). The fluorescent lipid RhoPE was added at 0.1% molar concentration in the lipid mixture.

