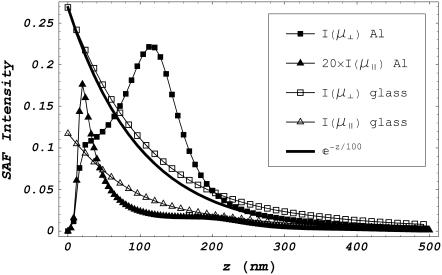
FIGURE 4.
SAF intensity as a function of dipole distance z from the metal/water (metal) or glass/water interface (glass). Constants are identical to those in Fig. 3 and collection is from the glass medium over a surface area that covers the solid cone of fluorescence emitted from the dipole and transmitting the interface with polar angle 105° ≤ θem ≤ 116° measured from the z axis in Fig. 2. SAF z-profiles are indicated for dipole components parallel (μ‖) or perpendicular (μ⊥) to the interface. Also depicted for comparison is the exponential function e−z/100. SAF intensity for μ‖ at the metal film has a peak height ∼20-fold smaller than the other intensities as indicated in the legend. All emission intensities fall off rapidly in z, implying SAF selectively detects probes near the interface.

