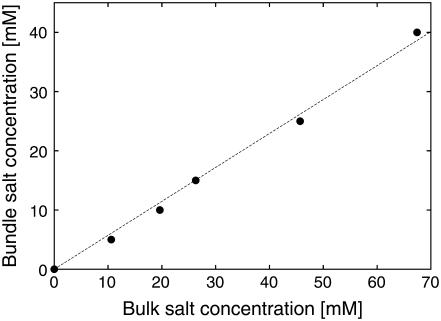
FIGURE 6.
Equilibrium distribution of salt between bundled and bulk phases, obtained from simulations via the procedure described in sections entitled “Determination of osmotic pressure” and “Simulation results”. The plot shows that in a stable actin-lysozyme complex the salt concentration is approximately half the bulk concentration. Error bars are of the order of the symbol size and the dotted line is a guide to the eye.

