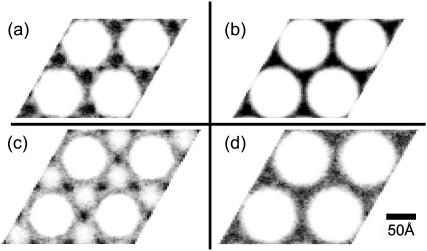
FIGURE 7.
Contour plots showing the lysozyme distribution in actin-lysozyme complexes without added salt, projected in the plane perpendicular to the bundle axis. Darker shading corresponds to higher concentrations, and the same shade corresponds to the same concentration in all four plots. In the equilibrium configuration (a), lysozyme is predominantly located in the threefold interstitial regions. By contrast, in a slightly expanded lattice (c), corresponding to the minimum osmotic pressure in Fig. 5, lysozyme is depleted from these regions and occupies the bridging regions instead. (b and d) Counterparts of panels a and c, respectively, in the absence of electrostatic forces. These control graphs confirm the important role of electrostatic interactions in the actual lysozyme distributions.

