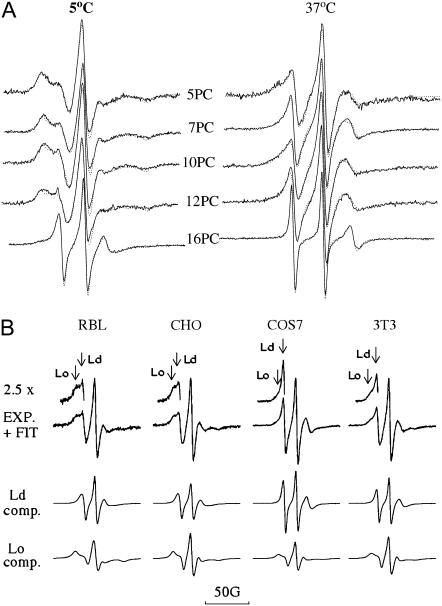
FIGURE 3.
ESR spectra of spin labels incorporated into the plasma membrane of live RBL-2H3 mast cells and spectral analysis by the NLLS method. (A) Spectra for 5PC, 7PC, 10PC, 12PC, and 16PC in RBL-2H3 cells recorded at 5°C and 37°C (solid lines) with the corresponding best fit simulations (dotted lines). (B) Spectra for 7PC at 25°C in RBL-2H3, CHO, COS-7, and NIH-3T3 cells. Upper spectra show experimental spectra and fits; middle and lower spectra show the resolved spectra for the more mobile (Ld) and less mobile (Lo) components, respectively. The insets to the upper spectra (×2.5 magnification) show distinctive features of both the Lo and Ld components as marked by vertical arrows.

