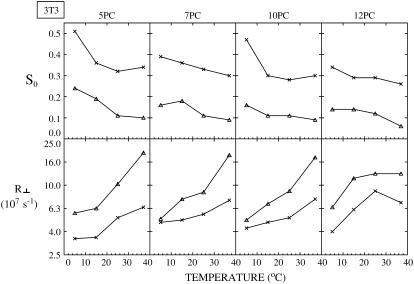
FIGURE 6.
For NIH-3T3 cells, plots of best fit values of the order parameter, S0, and the rotational diffusion coefficient, R⊥, of the two components (cross, Lo component; triangle, Ld component) of ESR spectra from different spin labels versus temperature. The thermally averaged fractions of the Ld spectral component P(Ld) are 0.37 ± 0.05 (5PC), 0.40 ± 0.12 (7PC), 0.47 ± 0.03 (10PC), and 0.45 ± 0.12 (12PC).

