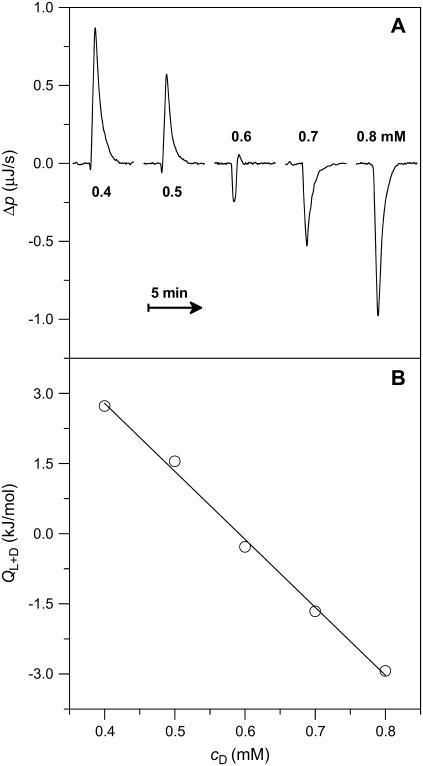
FIGURE 6.
ITC partitioning experiment at 65°C. 10-μL aliquots of a mixture consisting of 1.5 mM SDS and 1.0 mM POPC LUVs were injected to SDS at different concentrations. (A) Differential heating power, Δp, of the respective third peak of five independent titrations into the calorimeter cell containing SDS at the concentrations indicated in the panel. (B) Normalized heats of reaction, QL+D, versus SDS concentration in the cell, cD. Experimental data (circles) and linear regression analysis (solid line).

