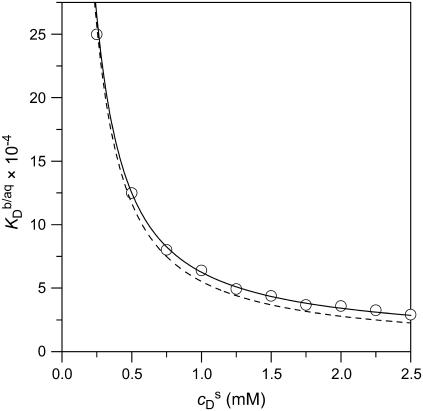
FIGURE 7.
Partition coefficient of SDS between the bulk aqueous phase and POPC bilayers,  as a function of the total detergent concentration in the syringe,
  The concentration of POPC LUVs was
  Experimental data as given by Eq. 8 (circles) and theoretical predictions according to Eq. 11 and
  calculated either without considering counterion binding by using Eqs. 12 and 13 (dashed line) or upon including Na+ adsorption to DS− by using Eqs. 12 and 16 (solid line).

