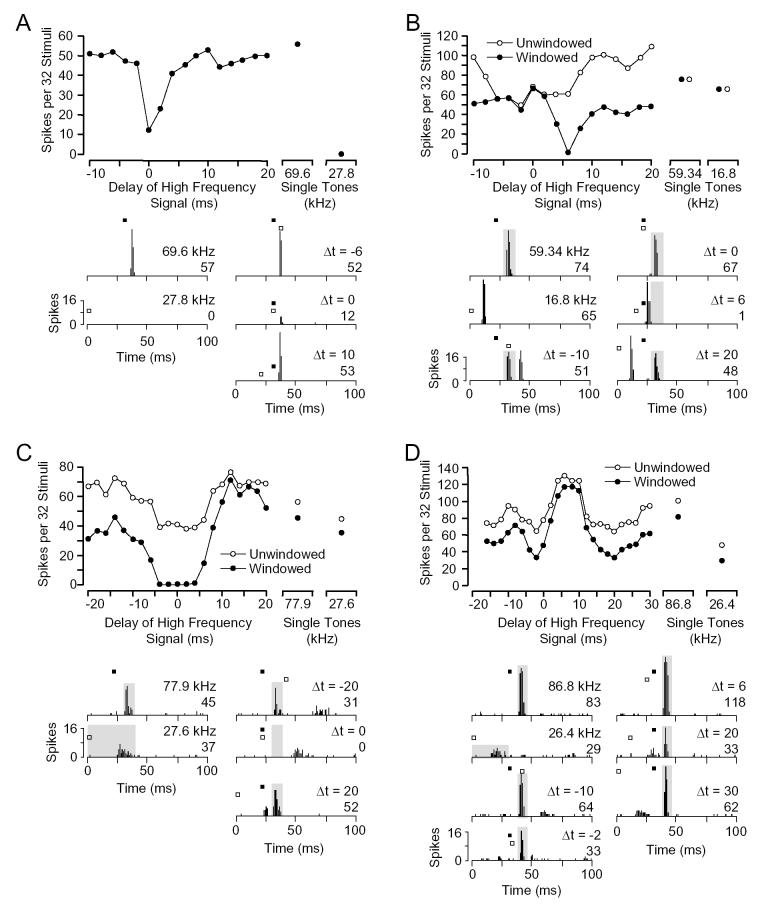
Fig. 1.
Types of inhibitory combination-sensitive units. For each type, we show the delay sensitivity curve and a series of peristimulus time histograms (PSTHs). The magnitude of responses to individual sounds is shown to the right of the delay curve. The higher frequency tone is the unit’s BF and the lower frequency (LF) tone is the unit’s best inhibitory tone. In PSTHs, the timing and duration of the BF and LF tones are indicated by filled and unfilled bars, respectively. Gray boxes in PSTHs indicate the time window within which response magnitude was evaluated. Spike counts and the delay curves are based on the time-windowed responses. The response functions with unfilled circles are based on spike counts within the entire 100 ms window. A: Type I unit shows best inhibitory interaction at 0 ms delay. [BF, 69.6 kHz, 48 dB SPL; LF, 27.8 kHz, 64 dB SPL] B: Type E/I unit shows excitatory responses to both low and high frequency tones, with the low frequency sound strongly inhibiting the high frequency response at 6 ms delay. [BF, 59.3 kHz, 25 dB SPL; LF, 16.8 kHz, 67 dB SPL] C: Type I/E unit shows inhibition at delays between -6 and 6 ms. [BF, 77.9 kHz, 41 dB SPL; LF, 27.6 kHz, 42 dB SPL] D: Type I/E unit with inhibition at short delays (-4 to 0 ms) and at long delays (14 to 26 ms). [BF, 86.8 kHz, 49 dB SPL; LF, 26.4 kHz, 50 dB SPL]

