
Fig. 2.
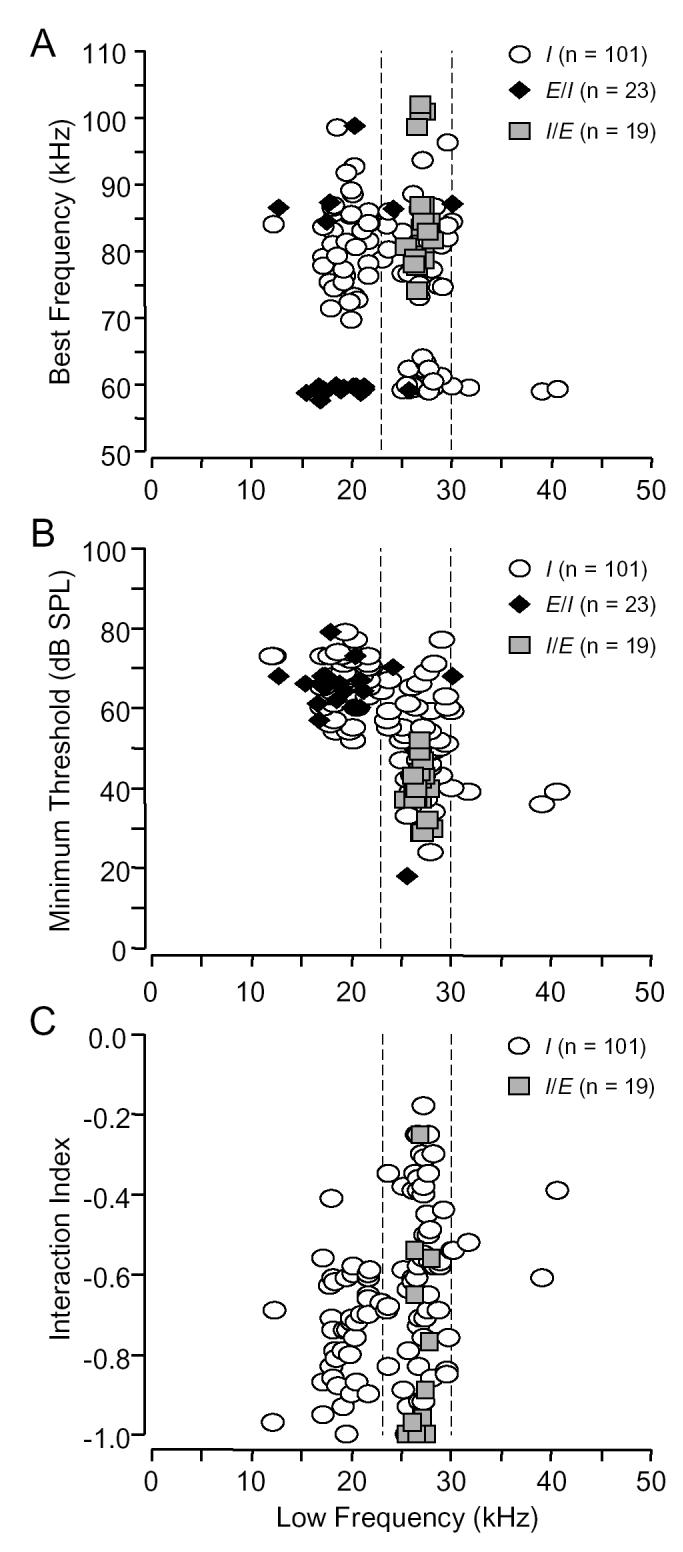
Frequency (A), threshold (B), and strength of inhibition (C) for different types of inhibitory combination-sensitive units. The dashed vertical lines indicate the frequency range associated with the first harmonic (23-30 kHz) of the biosonar call. A: Different inhibitory types had different distributions of best excitatory (high) and best inhibitory (low) frequencies. B: Inhibition tuned below 23 kHz had significantly higher thresholds than inhibition tuned to ⩾23 kHz (ANOVA, p <0.001). Type I/E units had significantly lower thresholds than similarly tuned type I units (ANOVA, p <0.001). C: In type I units, inhibition tuned <23 kHz (average: -0.74, 71% inhibition) was stronger than inhibition tuned ⩾23 kHz (average: -0.59, 54% inhibition)., but inhibition in type I/E units (average: -0.87, 93% inhibition) was strongest (t-tests, p <0.05).