Figure 2.
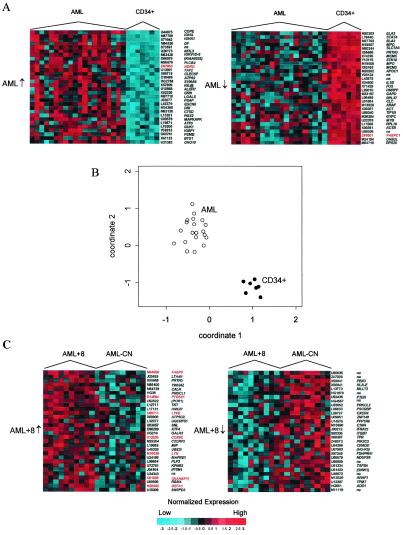
(A) Genes distinguishing AML and CD34+ samples. Expression profiles for the 30 most up-regulated (left, AML↑, from highest to lower) and down-regulated (right, AML↓, from lowest to higher) genes between AML and CD34+ samples. Normalized intensities are presented for each gene as standard deviations of log intensity above the mean (red) and below the mean (blue) across samples. Similarly generated data for genes distinguishing AML+8 and AML-CN are shown in Fig. 6, which is published as supplemental data on the PNAS web site at www.pnas.org. (B) Coordinate plot obtained by averaging the unit normal deviates for genes in A that were down-regulated (coordinate 1) and up-regulated (coordinate 2) in AML vs. CD34+. Cross-validation revealed perfect class prediction based on this simple rule. (C) The corresponding analyses for the most significantly dysregulated genes in AML+8 vs. AML-CN. Genes are identified by their GenBank accession number and symbol. Preliminary symbols are indicated in parentheses. Genes on chromosome 8 are highlighted (red).

