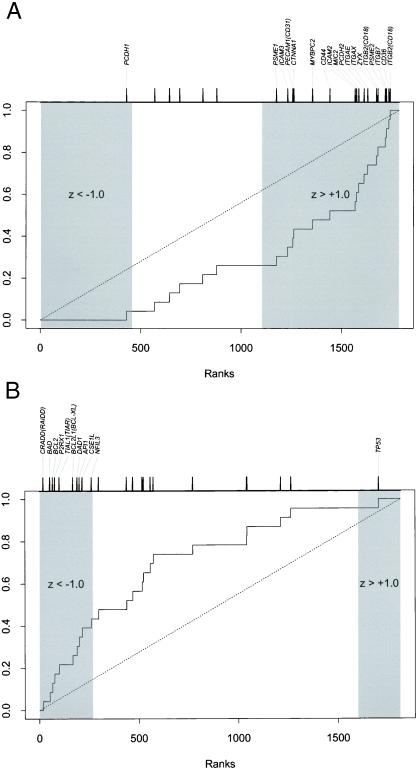
Figure 4.
Systematic functional analysis of AML samples based on SWISS-PROT database functional annotations for expressed genes. z statistics were calculated for each gene to describe the expression difference in that gene across sample groups. The plots show the cumulative distribution for the ranks of the genes in the functional category relative to all expressed genes. The tick marks at the top of the plots show the ranks of the individual genes; only those showing significant dysregulation (z scores below −1 or above +1) are indicated. (A) Twenty-three expressed genes involved in cell adhesion showed a shift to the right indicating up-regulation of genes in the AML compared with CD34+ samples (P = 0.010). (B) Twenty-three genes involved in apoptosis showed a shift to the left indicating down-regulation in AML+8 compared with AML-CN (P < 0.001).

