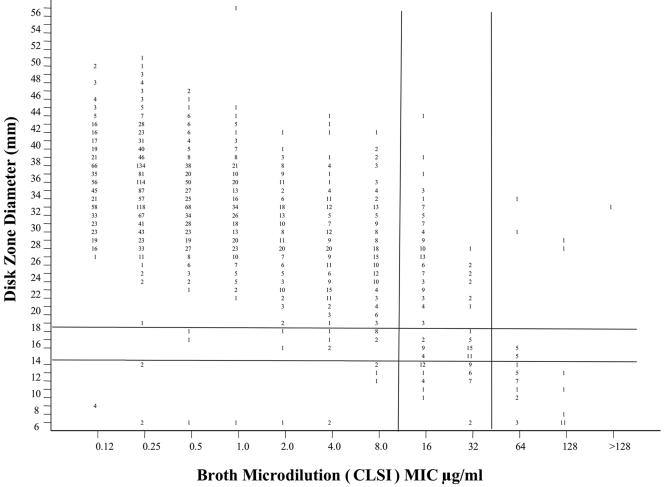
FIG. 3.
Scatterplot showing the relationship between fluconazole MICs and zone diameters for 2,949 isolates of Candida species. The proposed interpretive breakpoints for each test method are indicated by the horizontal and vertical lines. (Adapted from reference 72.)

