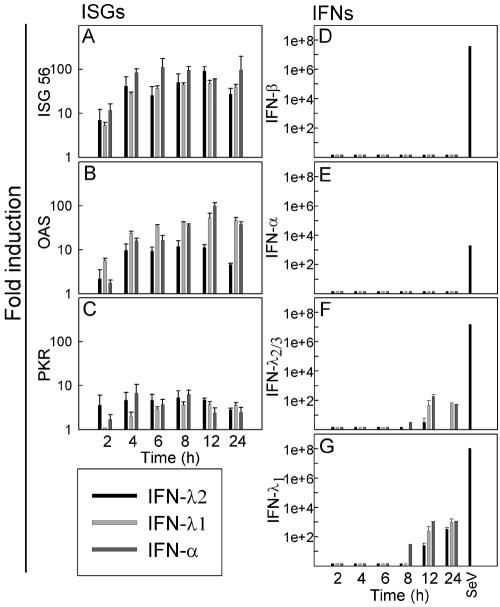
FIG. 2.
Expression of ISGs and IFNs in HepG2 cells after stimulation with IFN-λ1, IFN-λ2, or IFN-α. The cells were seeded and treated with 125 ng/ml of IFN-λ1, -λ2, or -α (i.e., ∼125 IU/ml IFN-α). Total cellular RNA was extracted 2, 4, 6, 8, 12, or 24 h after stimulation, and expression of (A) ISG56, (B) OAS, (C) PKR, (D) IFN-β, (E) IFN-α, (F) IFN-λ2/3, and (G) IFN-λ1 was analyzed by real-time PCR. For a positive control, RNA was harvested from A549 cells infected for 6 h with SeV. The results are shown as means ± SD (error bars).

