FIG. 3.
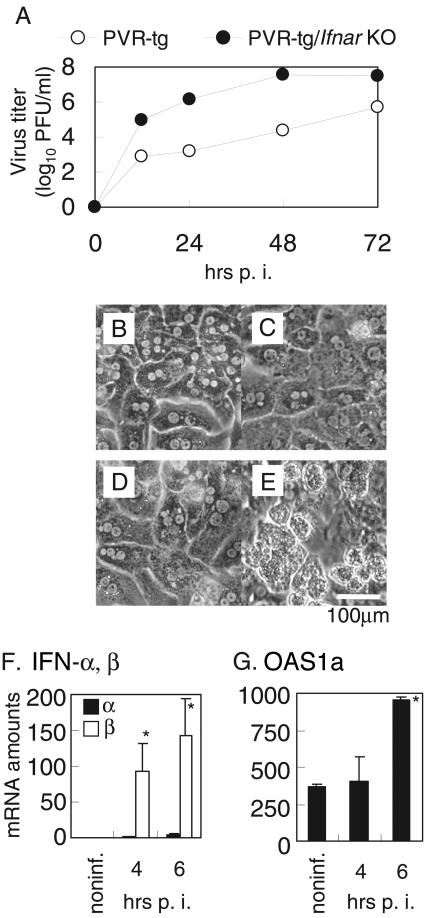
PV replication and IFN response in cultured liver cells. (A) Time course of PV titers in cultured liver cells. Primary cultured liver cells from PVR-tg mice and PVR-tg/Ifnar knockout (KO) mice were infected with PV at an MOI of 0.001. At each time point, PV titers were determined by plaque assay. Note that the titer in the cells from PVR-tg mice increased much more slowly than that in cells from PVR-tg/Ifnar knockout mice. (B to E) Morphology of primary cultured liver cells. Liver cells from PVR-tg mice (B and C) and from PVR-tg/Ifnar knockout mice (D and E). Uninfected liver cells are monotonic (B and D). The cells were infected with PV at an MOI of 1.0 and observed at 24 h p.i. (C and E). The CPE was rarely observed in the liver cells from PVR-tg mice (C) but was clearly observed in liver cells from PVR-tg/Ifnar knockout mice (E). (F and G) IFN response in liver cells from PVR-tg mice. The cells were infected with PV at an MOI of 10. Total RNA of the cells was isolated, and the IFN-α/β (F) and OAS1a (G) mRNA levels were determined by quantitative real-time PCR analysis. The asterisks indicate a significant difference (P < 0.05; Student's t test) in comparison with the uninfected (noninf.) samples. The SEM are indicated by vertical bars. Note that the vertical scales in panels F and G are different from those in Fig. 1G to 1J.

