FIG. 3.
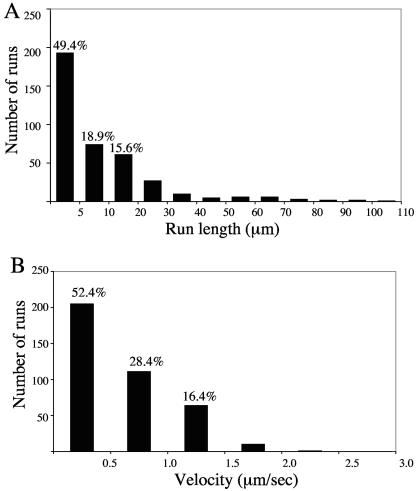
Analysis of HSV particle movements. Microtubule motility events like those shown in Fig. 2 were quantitated for 391 green fluorescent particles. (A) Histogram of run lengths of motile HSV. The pixel lengths of each run were measured as described in Materials and Methods and converted to micrometers. The average run length was 11.81 ± 0.89 μm. The percentage of particles that traveled less than 5 μm, between 5 and 10 μm, and between 10 and 20 μm is indicated above the respective bars. (B) Histogram of velocity of motile HSV. The average velocity of each run was calculated by dividing the run length by its temporal duration. The overall average velocity was 0.58 ± 0.02 μm/s. The percentage of particles with velocities less than 0.5 μm/s, between 0.5 and 1.0 μm/s, and between 1.0 and 1.5 μm/s is indicated above the respective bars.

