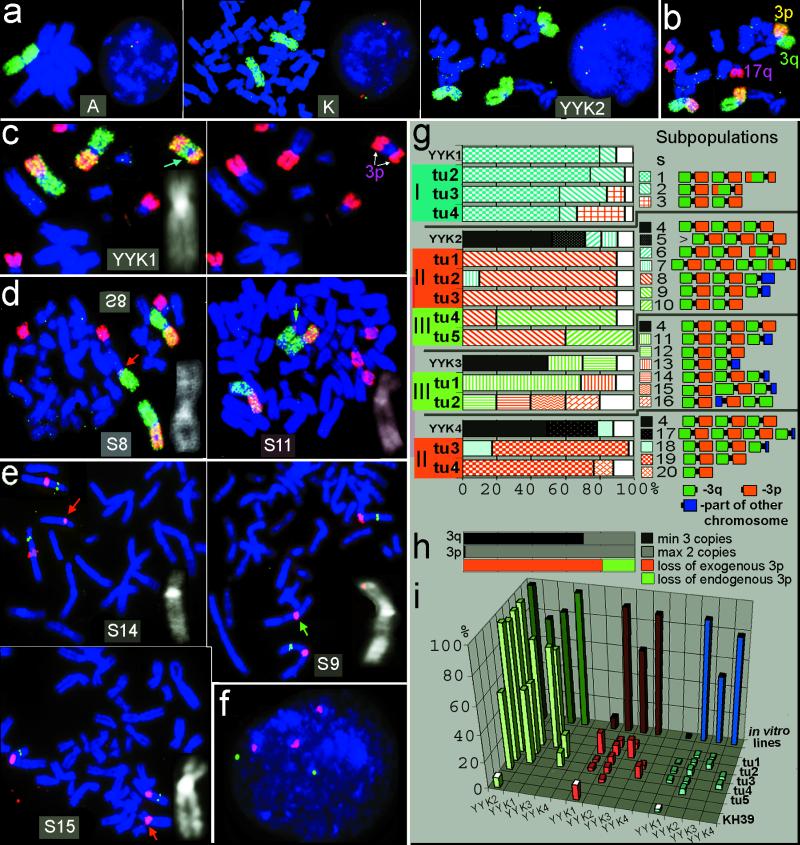
Figure 1.
FISH analysis of chr3 in A9Hytk3, KH39, YYKs, and 12 YYK-derived SCID tumors (groups I–III). Subpopulations (S1–20) were identified according to the number and morphology of chrs3 (rearranged chromosomes are marked by arrows and magnified as black and white DAPI-banded images at the corner of boxes). (a) Chr3 painting (green) and interphase FISH (red, RP6–19p19; green, Rp6–102f2) analyses of chr3 copy number in cell lines: A, A9Hytk3 (donor of chr3); K, KH39 (recipient); and YYK2 (one of the generated MCHs). (b) Arm-specific painting as described in Materials and Methods for the same metaphase of YYK2. (c) Pericentric inversion in YYK1. (d) Loss of 3p in tumor cells (S8, S11). (e) Loss of CER1 on rearranged chr3 in tumors (S14, S15, S9) shown by FISH with chr3 centromere (red) and CER1 PAC 188 g11 (green) probes on metaphases. (f) Loss of the third copy of CER1 detected by interphase FISH in YYK2 tu1 (same probes as in e). (g) Percentage of different cell subpopulations (S1–S20) in YYKs and derived tumors. Black patterns on bars: minimum three intact chrs3. Color patterns: maximum two intact chrs3. Blue patterns: exogenous 3p rearranged in vitro (blue arrow in c). Red patterns: exogenous 3p lost in vivo (red arrows in d and e). Green patterns: endogenous 3p loss (green arrows in d and e). White: other minor (<10%) subpopulations. (h) Retentions vs. losses on 3q and 3p (black vs. gray, counted from g, II and g, III, results shown in g). Ratio of exogenous vs. endogenous 3p losses (red vs. green, counted from total exogenous 3p losses in g, II and red vs. green bars in g, III shown in g). (i) Percentage of cells with minimum three signals of: chr3 centromere (green) and CER1 PAC 188 g11(red) (based on interphase FISH as illustrated in c); intact chrs3 (blue) (based on metaphase FISH, shown in a and b) in YYK in vitro lines, derived tumors, and original KH39 line.

