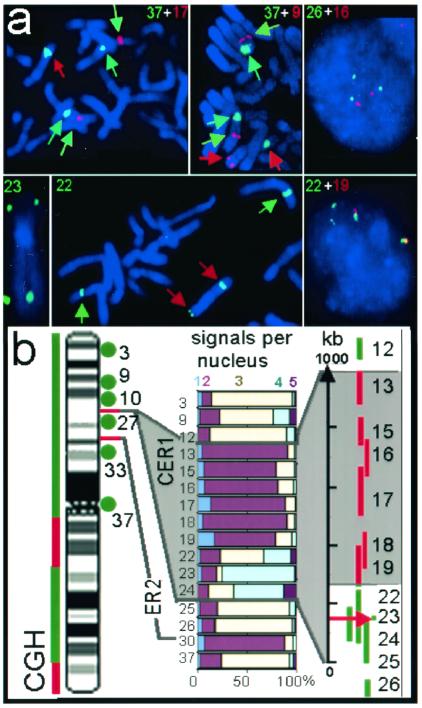
Figure 2.
FISH mapping of 3p deletions in YYK1. Probes are shown by numbers, the corresponding names and locations are listed in fig 3. (a) Metaphase and interphase FISH. Probe number and color as indicated. Signals on the rearranged chr3 are marked by red arrows, on the normal chromosomes by green arrows. (b) From left to right: CGH of YYK1 vs. KH39—gain over 3p and 3q21–27 (vertical green bars) and no gain (large deletions in additional chr3) in the regions marked by vertical red bars. Green circles indicate retained FISH probes on the rearranged chrs3, red lines show the positions of deleted CER1 and its borders (12 probes) and ER2 (deleted probe 30). Horizontal bars: % of nuclei with 1–5 signals for different FISH probes. Final map of the CER1 deletion in kb scale (see ref. 6). Red lines indicate deleted probes; green lines indicate retained probes; and red arrow indicates disrupted probes (probes 22, 23, and 24).

