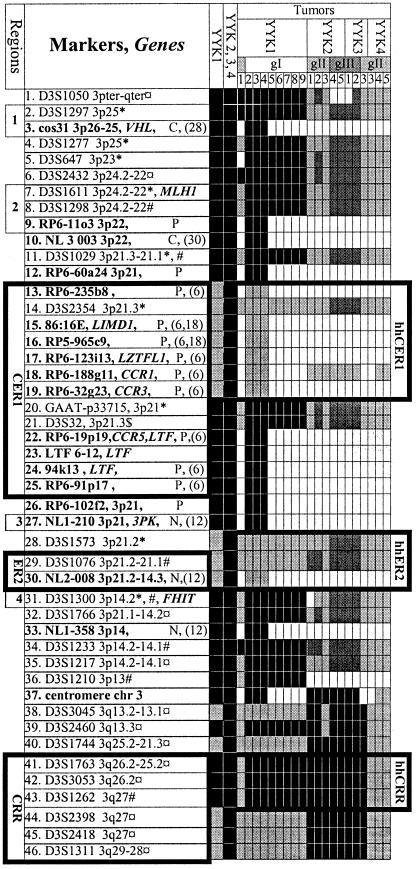
Figure 3.
Polymorphic (normal letters) and FISH (bold) marker analysis of YYKs and 20 derived tumors divided in 3 groups (gI–gIII). Italics, relevant genes. Microsatellite marker labeling: * by 32P, ¤ by fluorescence, # by peroxidase (ECL kit). $, restriction fragment length polymorphism (RFLP) marker; C, cosmid; P, PAC; N, NotI clone (references). Black boxes: two alleles or minimum three FISH signals per cell. Light gray boxes: LOH or maximum two FISH signals per cell. Dark gray boxes: two alleles, but loss of one 3p copy by FISH. White boxes: not done (in YYK2 tumors, YYK3 tu1 and tu2 and YYK4 tu4 and tu5 most of FISH markers were not tested, because painting has shown an entire 3p copy loss).

