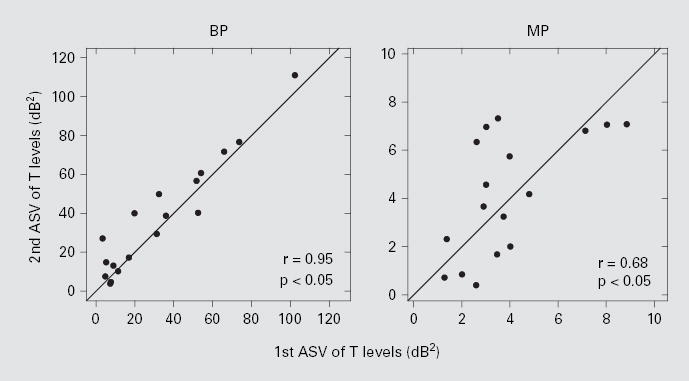
Fig. 2.

Relationship of the ASV of T levels between the first and the second measurements that spanned an average of 8.9 months. The left and right panels are for BP and MP stimulations, respectively. Both correlation coefficients (r) were statistically significant (z test; p < 0.05).
