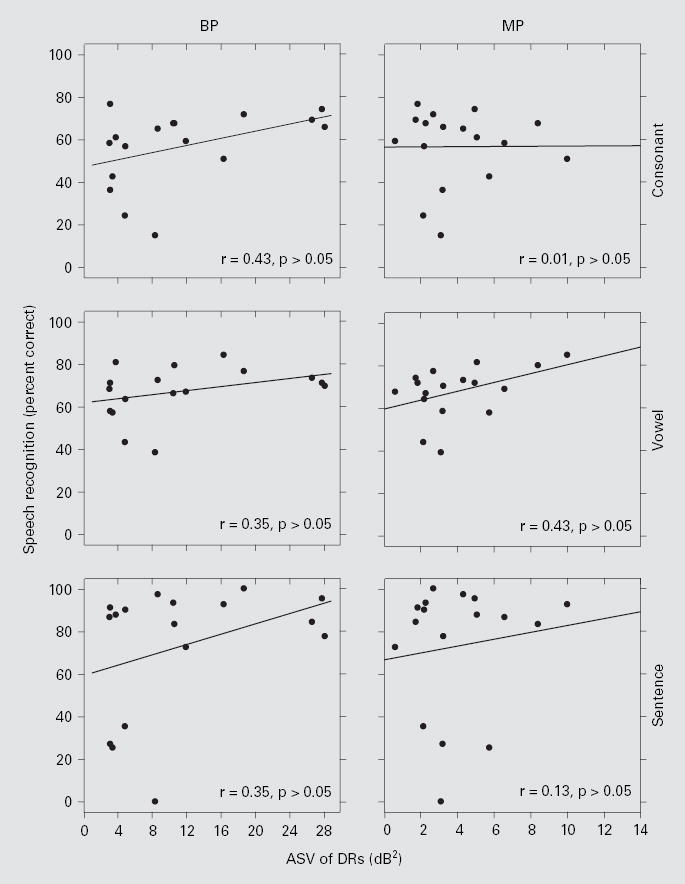
Fig. 4.

Speech recognition scores as a function of ASV of DR. Each data point represents 1 of the 17 subjects. The left column is for BP stimulation and the right column is for MP stimulation. The three rows, top to bottom, represent the data from consonant, vowel, and HINT sentence (+10 dB S/N) tests, respectively. Linear regression lines are shown with the correlation coefficients (r) indicated at the lower right corner of each panel. None of the r values were statistically significant (z test; p > 0.05).
