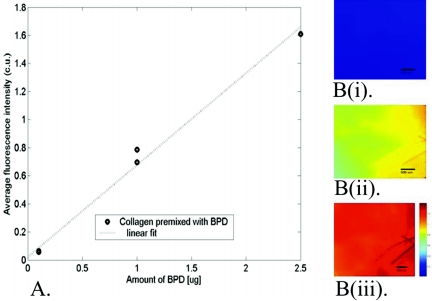
FIG. 6.
(A) Correlation of the calibrated fluorescence intensity (calibrated units [c.u.]) from the in vivo fluorescence microscopy images with the amount of BPD mixed into the collagen pellets. Four different samples were mixed with either 0 mg, 0.1 mg, 1.0 mg, or 2.5 mg BPD. The average calibrated intensity from the fluorescence microscopy images of each pellet is plotted with the amount of BPD added to each pellet. (B) Typical calibrated fluorescence images acquired from collagen implants (i) before BPD injection, (ii) 30 min after BPD injection, and (iii) 60 min after BPD injection. An identical brightness scale was employed for all the images, as shown in panel B(iii).

