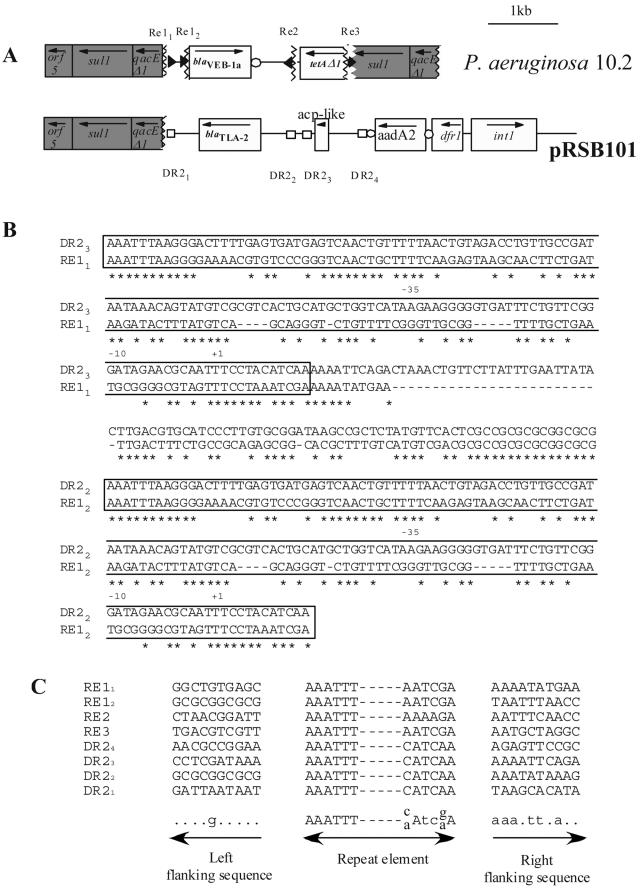
FIG. 2.
(A) Schematic representations of the genetic environment of the blaVEB-1 gene in P. aeruginosa 10.2 and blaTLA-2 gene from plasmid pRSB101. The flanking sequence identity breakpoints in the blaVEB-1-like gene environment are designated by vertical broken lines. The homology breakpoints are designated by broken lines. The Re of the blaVEB-1 gene environment and the DR2 elements are represented by black triangles and white squares, respectively. The coding regions are shown as boxes, with an arrow indicating the orientation of transcription. Dark-gray filled boxes correspond to genes or ORFs present on class 1 integron conserved sequences. White circles indicate 59-be's. (B) Nucleotide alignment of the Re1-Re1 region of P. aeruginosa 10.2 and the DR2.3-DR2.2 region from plasmid pRSB101 (40). Re and DR2 elements are boxed. Dashes represent gaps that have been introduced into the alignment. Stars represent identical positions between the two sequences. The +1, −10, and −35 written below the sequences correspond to promoter sequences identified by Aubert et al. (2). (C) Nucleotide alignment of the flanking sequences of the different Re and DR2 elements. A consensus sequence is written below the alignment. Capital letters represent highly conserved positions (eight out of eight), and small letters represent positions with moderate conservations (five out of eight). Dots represent polymorphic positions.

