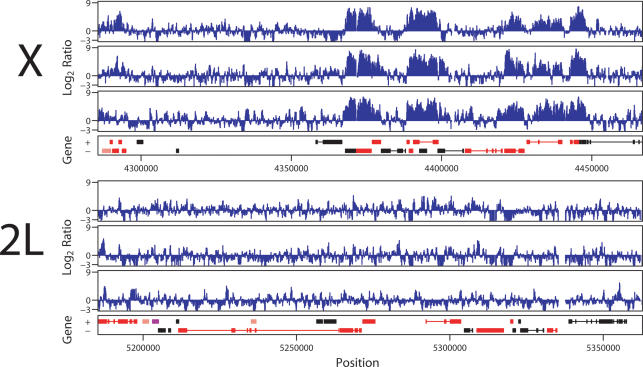
Figure 2.
High-resolution ChIP–chip analysis of MSL3-TAP binding to chromosomes X and 2L. (Top) X chromosome. (Bottom) Chromosome 2L. A 180-Kb section is shown for each, representing the hybridization to ∼1800 50mers, or ∼0.5% of the total data set. For each chromosome, results from one experiment, a corresponding dye-swap, and a second independent experiment are aligned above the gene annotation for each segment. Genes expressed from left to right are shown above genes expressed from right to left. Rectangles represent exons, connected by lines that represent introns. Red genes are expressed while black genes are not expressed as determined by Affymetrix analysis of SL2 cells. MSL binding is enriched on the X chromosome over expressed genes.

