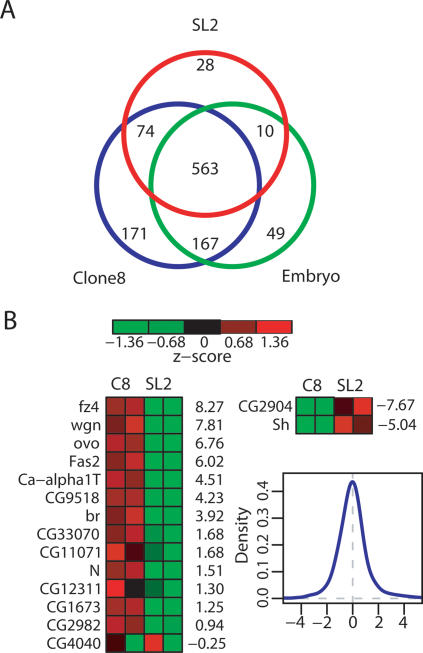
Figure 4.
The MSL-binding pattern is largely common to late-stage embryos and two cell lines, but is not invariant. (A) Venn diagram showing the relationships between genes bound by SL2 cells (red), Clone 8 cells (blue), and embryos (green). This is a conservative number, as only the clearly bound genes are considered, while intermediate genes are not included in the totals. (B) Fourteen genes were identified as clearly bound in Clone 8 cells and clearly unbound in SL2 cells. Their normalized expression levels are shown on the left, ordered by the log fold ratios between the cell types, listed on the right of the heat map. The expression levels are higher in Clone 8 cells in all cases, except CG4040, which had low transcription resulting in an unreliable fold ratio (see Supplementary Table 2). For the two genes identified as clearly bound in SL2 and unbound in Clone 8, expression levels are much higher in SL2. The density plot shows that the distribution of log fold ratios for all genes is centered at zero and that the ratios observed here are not due to an overall shift.

