Figure 1.
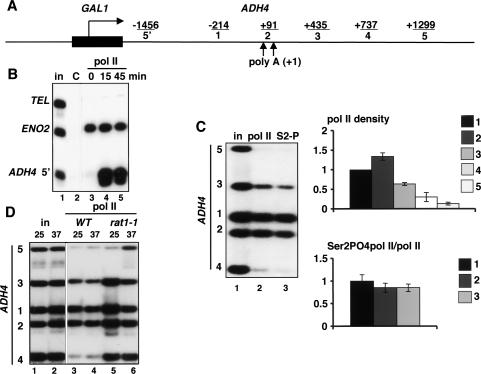
Transcription termination at the chromosomal ADH4 gene. (A) Diagram of GAL1-ADH4. PCR products are indicated with the distances in base pairs from the center of each to the major poly(A) site (+1). Upward arrows indicate the two poly(A) sites. (B) Inducible transcription of GAL1-ADH4. Pol II ChIP of GAL1-ADH4 in wild-type cells (DBY548) induced with galactose for the indicated times. The ADH4 5′ primer pair (−1456 in A) was used. ENO2 is a positive control, and telomere VIR (TEL) is a nontranscribed negative control. IPs were with polyclonal anti-pan CTD that detects total pol II. (in) Input chromatin; (C) control IP with irrelevant antibody. (C) Transcription termination and CTD Ser2 phosphorylation. Anti-pol II ChIP with anti-pan CTD as in B, and anti-Ser2 phosphorylated CTD (S2) in the wild-type strain DBY548. Total pol II density relative to the value at position 1 in the ORF, normalized to input, is shown in the top graph. Ser2 phosphorylated pol II, normalized to total pol II, is shown in the bottom graph. (D) Termination at ADH4 is inhibited by inactivation of Rat1. Pol II ChIP of wild-type (DBY548, lanes 3,4) and rat1-1 (DBY745, lanes 5,6). Note the delayed termination with high pol II at positions 3 and 4 in rat1-1 at 25°C (lane 5) relative to wild type (lane 3).

