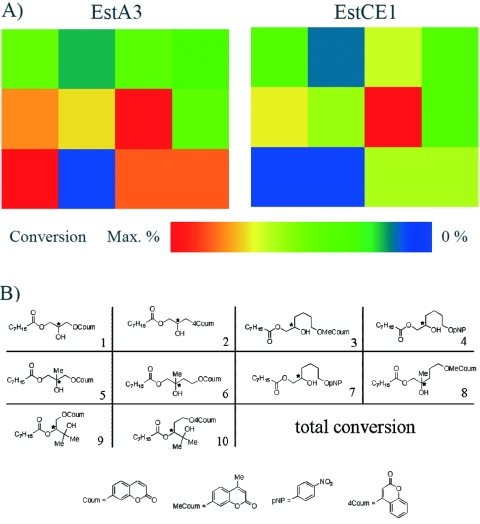
FIG. 3.
Fingerprint analysis of the conversion of 10 different model substrates by EstCE1 and EstA3. (A) The substrate with highest conversion was set as the maximum (red), and the strength of conversion of the other substrates is indicated according to the color scheme. The colored boxes represent substrates 1 to 10 according to the order shown (B); the stereocenter of each molecule is indicated with an asterisk. The percent total conversion is color coded in the two squares at the lower right-hand side.

